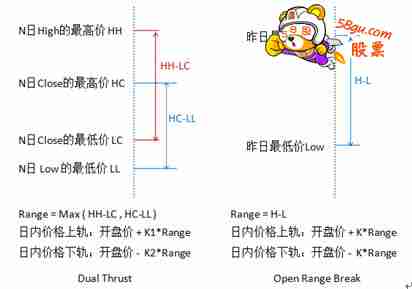
Dual Thrust与R-Breaker一样,曾长期排名Future Trust杂志最赚钱的策略。该策略在形式上和开盘区间突破策略类似。不同点主要体现在两方面:Dual Thrust在Range(代码中的浮动区间)的设置上,引入前N日的四个价位,使得一定时期内的Range相对稳定,可以适用于日间的趋势跟踪;Dual Thrust对于多头和空头的触发条件,考虑了非对称的幅度,做多和做空参考的Range可以选择不同的周期数,也可以通过参数K1和K2来确定。 来源 www.88gs.com 当K1<K2时,多头相对容易被触发,当K1>K2时,空头相对容易被触发。因此,投资者在使用该策略时,一方面可以参考历史数据测试的最优参数,另一方面,则可以根据自己对后势的判断,或从其他大周期的技术指标入手,阶段性地动态调整K1和K2的值。
 此主题相关图片如下:dual thrust.jpg 此主题相关图片如下:dual thrust.jpg
 //策略:Dual Thrust//类型:日内//修订时间:2012.11.1 //策略:Dual Thrust//类型:日内//修订时间:2012.11.1
//Designed By Rogarz//中间变量input:n(1,1,100,1),K1(0.7,0.1,1,0.1),k2(0.7,0.1,1,0.1),nmin(10,1,100,1),ss(1,1,100,1);CYC:=barslast(date<>ref(date,1))+1;昨高:=callstock(stklabel,vthigh,6,-1);昨低:=callstock(stklabel,vtlow,6,-1);昨收:=callstock(stklabel,vtclose,6,-1);开盘价:=valuewhen(cyc=1,open);HH:=hhv(昨高,n);//N日high的最高价HC:=hhv(昨收,n);//N日close的最高价LC:=LLV(昨收,n);//N日close的最低价LL:=LLV(昨低,n);//N日low的最低价浮动区间:=max(HH-LL,HC-LL);//range上轨:开盘价+k1*浮动区间;下轨:开盘价-K2*浮动区间;t1:=time>opentime(1) and time<closetime(0)-nmin*100;t2:=time>=closetime(0)-nmin*100;手数:=ss;//交易条件 www.88gs.com开多条件:=c>上轨 and holding=0;开空条件:=c<下轨 and holding=0;//交易系统开多:buy(开多条件 and t1 and cyc>1,手数,market);开空:buyshort(开空条件 and t1 and cyc>1,手数,market);收盘平多:sell(t2,手数,market);收盘平空:sellshort(t2,手数,market);这个策略在论坛中已有很多个版本,这个版本——引入了前N日的四个价位,以及K1、K2参数。默认参数设置与原论坛中的策略一致,为前一日,K1=k2=0.7.////////////////////////=================================================第二种版源码:适合日线以下 任何周期 中间直接调用 日线数据 不过每天要把画面切换到 日线周期 刷新一个昨日的日线数据还有注意费率设置 要改成期货 15% 合约单位 按该品种自己调整 手续费自己调整input:k(0.7,0.1,1,0.1);
predayhigh:=callstock(stklabel,vthigh,6,-1);//昨日最高价
predaylow:=callstock(stklabel,vtlow,6,-1);//昨日最低价
predayclose:=callstock(stklabel,vtclose,6,-1);//昨日收盘价
predayrange:=max(predayhigh-predayclose,predayclose-predaylow);//取大波动值
dayopen:=callstock(stklabel,vtopen,6,0);//今天开盘价
upperband:intpart(dayopen+k*predayrange),colorred;//区间上沿
lowerband:intpart(dayopen-k*predayrange),colorgreen;//区间下沿下日波动:max(callstock(stklabel,vthigh,6,0)-callstock(stklabel,vtclose,6,0),callstock(stklabel,vtclose,6,0)-callstock(stklabel,vtlow,6,0))*0.7;
if holding=0 then begin
if high>=upperband then
buy(1,volunit,limitr,max(open,upperband));
end
if holding=0 then begin
if low<=lowerband then
buyshort(1,volunit,limitr,min(open,lowerband));
end
if holding>0 then begin
if low<=lowerband then begin
sell(1,holding,limitr,min(open,lowerband));
buyshort(1,volunit,limitr,min(open,lowerband));
end
if time>=closetime(0) then
sell(1,holding,limitr,close);
endif holding<0 then begin
if high>=upperband then begin
sellshort(1,holding,limitr,max(open,upperband));
buy(1,volunit,limitr,max(open,upperband));
end
//www.88gs.com
if time>=closetime(0) then
sellshort(1,holding,limitr,close);
end
资产:ASSET,PRECISION0,NOAXIS,COLORFF00FF;
goodin:=(1-(asset/hhv(asset,5520)))*100;
资产回撤百分比:goodin;
资产实际亏损:hhv(asset,5520)-asset,COLORgreen;//////////////=================================第三版本源码:input:k(0.7,0.1,1,0.1);dist1:=barslast(day>ref(day,1))+1;
dist2:=ref(dist1,dist1);predayhigh:=ref(hhv(high,dist2),dist1);
predaylow:=ref(llv(low,dist2),dist1);
predayclose:=ref(close,dist1);
predayrange:=max(predayhigh-predayclose,predayclose-predaylow);="Verdana">dayopen:=ref(open,dist1-1);upperband:=dayopen+k*predayrange;
lowerband:=dayopen-k*predayrange;if holding=0 then begin
if high>=upperband then
buy(1,volunit,limitr,max(open,upperband));
endif holding=0 then begin
if low<=lowerband then
buyshort(1,volunit,limitr,min(open,lowerband));
endif holding>0 then begin
if low<=lowerband then begin
sell(1,holding,limitr,min(open,lowerband));
buyshort(1,volunit,limitr,min(open,lowerband));
end
// www.88gs.com
if time>=closetime(0) then
sell(1,holding,limitr,close);
endif holding<0 then begin
if high>=upperband then begin
sellshort(1,holding,limitr,max(open,upperband));
buy(1,volunit,limitr,max(open,upperband));
end
//if time>=closetime(0) then
sellshort(1,holding,limitr,close);
end资产:asset,noaxis,colorred,linethick2; |


